We achieved majority of our responsibility targets in 2022
We will report more on our responsibility work this spring, when the Algol Group’s first responsibility report will be published. Find out more about our sustainability.
Safety 
- Target: 0 accidents and 59 safety walks
- Result: 1 accident and 72 safety walks
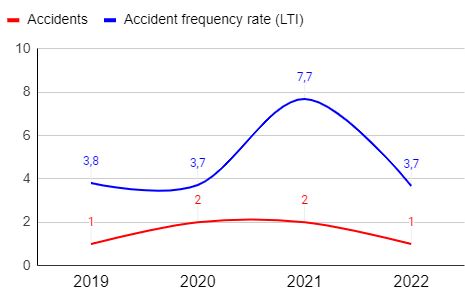
Figure 1. Accidents and accident frequency rates (LTI) in 2019-2022.
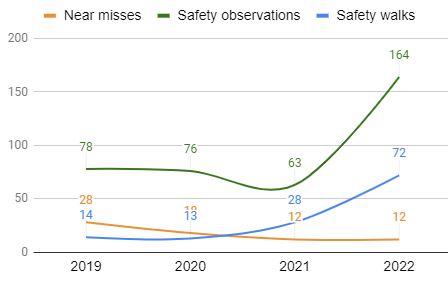
Figure 2. Safety walks and reported safety observations in 2019- 2022.
Occupational wellbeing
- Target: Healthy and committed employees
- Result: eNPS 16.7
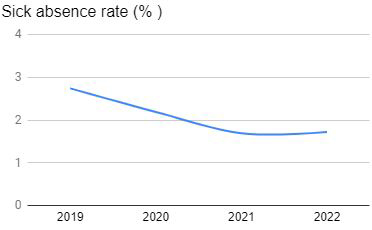
Figure 3. Sick absence rate 2019-2022.
Supply chain responsibility 
- Target: Responsibility assessments of our cooperation partners
Result: 19 supplier responsibility assessments complete
We require all our suppliers and subcontractors to sign our Supplier Code of Business Conduct. In addition, we have guidelines and principles for selecting and assessing cooperation partners. New suppliers are also carefully assessed from the perspective of responsibility. Existing suppliers are assessed as needed. In addition to the above-mentioned activities, 20 already approved suppliers are selected for assessments each year. The number of completed assessments fell short by one. In connection with future assessments, we will enhance communications related to the topic to ensure that the meaning is clear to all parties in the supply chain and that all the information necessary for the assessment can be collected without delay.
Environment 
- Target: Sustainable use of resources and reduced emissions
- Result: 53% reduction in the amount of chemical waste
As a distributor and packer of chemicals, the most significant environmental impacts are caused by the use of resources in our own production facilities, the storage of our products, and transportation. In 2022, we paid closer attention to the generation of waste due to product obsolescence. By monitoring product shelf life more effectively, optimising purchase quantities, and working together with supply chain operators, we were able to reduce the total amount of chemical waste by 53% compared to the previous year. We also collect emissions data from product manufacturers, suppliers and transport companies.
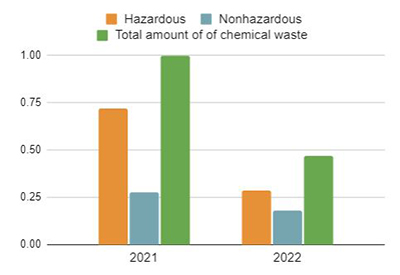
Kuva 4. Share of chemical waste compared to the total amount in 2021, 2022.